As we have finished our latest cycle of data collection for our Postgraduate research (PGR) students, the StudentSurvey.ie team have been busy reviewing some of the longitudinal trends in the data relating to self-funding.
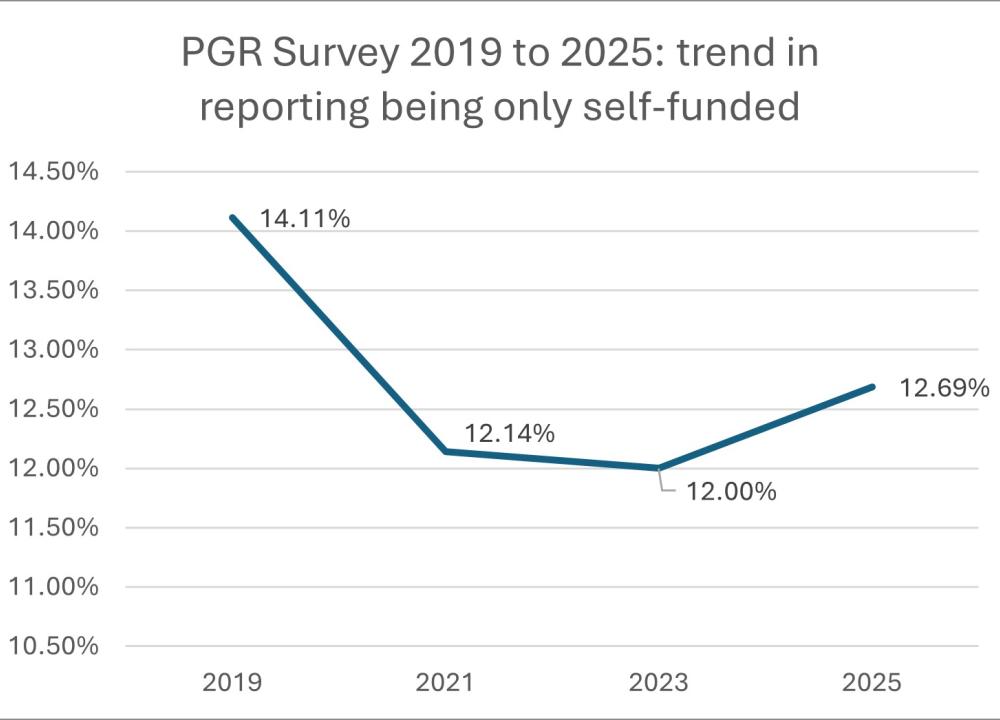
First up, we look at the trend for those research students who report being solely self-funded**. We will examine weighted data from the four waves of PGR data: 2019, 2021, 2023 and 2025***.
Overall, we see that there has been a decline in the proportion of students who reported being only self-funded since 2019. Just over 14% reported self-funding in 2019 while in 2021, 2023 and 2025 approximately 12% reported self-funding.
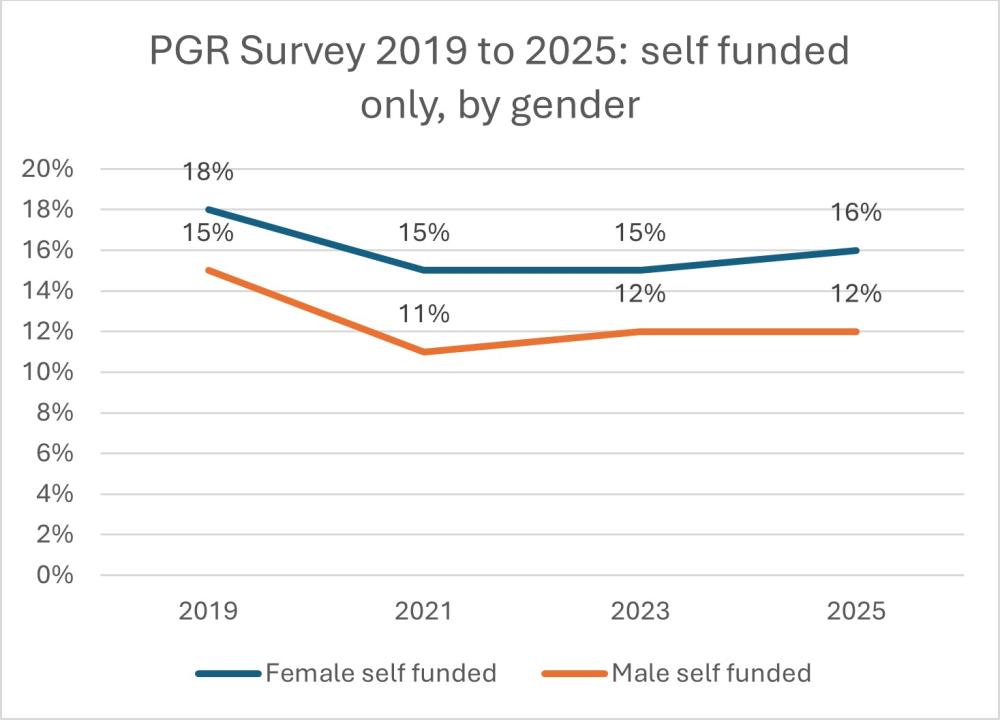
Gender
A higher proportion of females are self-funded compared to males. This is likely due to higher prevalence of females in fields of study that attract less funding. The rate of self-funding for females was 18% in 2019 but has decreased to in and around 16% since then. However, from 2019 to 2025, males remain likely to be self-funded.
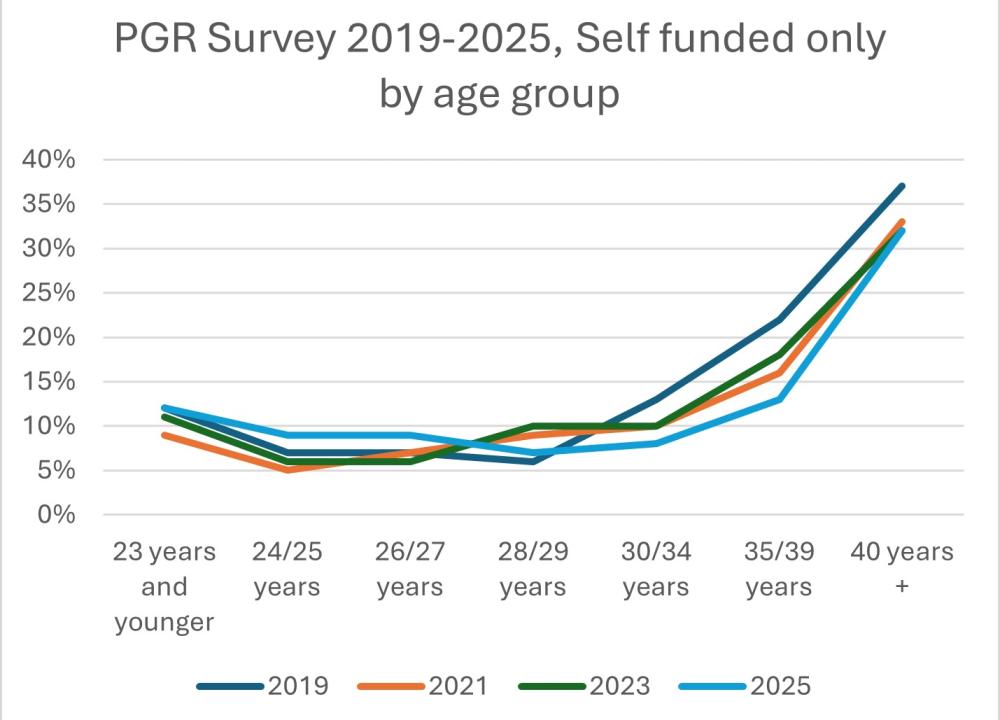
Age
Age groups are shown across the bottom here and the lines represent the survey year. Here we see a strong relationship where the older the age group the higher the rate of self-funding.
Programme type
Masters by Research students have historically had a higher rate of self-funding compared to PhD students, but given the different funding mechanisms available to PhD. students, this is not surprising. However, this gap grew in 2021 and widened further in 2023 and 2025, as the proportion of PhD. students self-funding only dropped, while the rate among master’s students increased substantially. It is worth noting that the number of survey respondents studying for a Masters by Research is relatively small (circa 500 in 2025), and this may produce more volatile results for a statistic such as self-funding. It will be interesting to see if these trends continue in 2027.
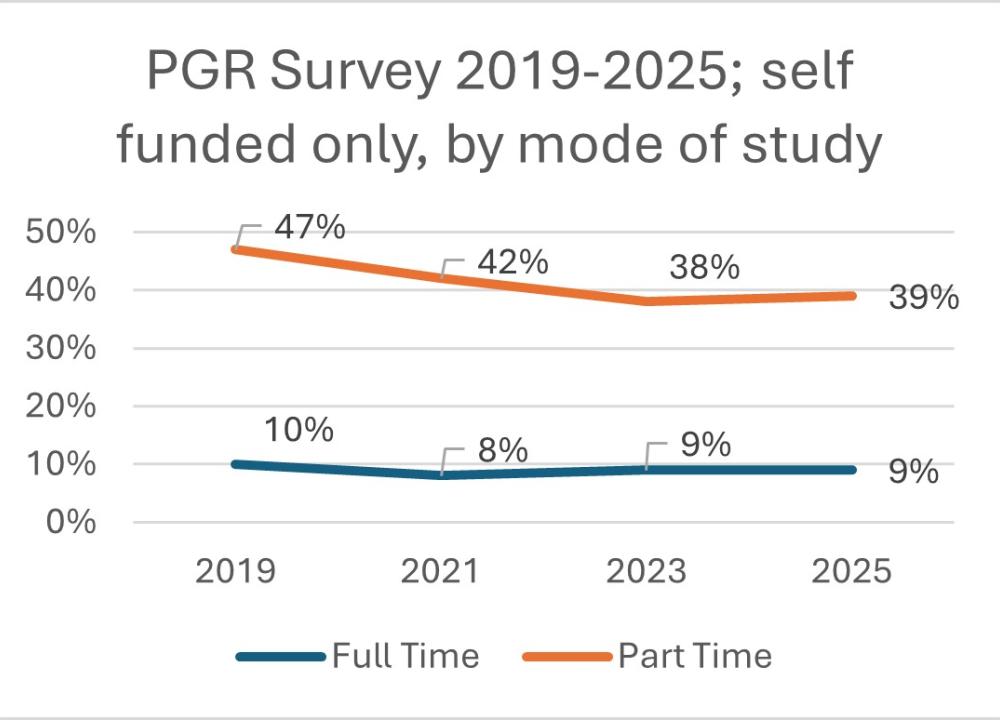
Mode of study
Next up is mode of study. Here we see a wide disparity between full-time and part-time/remote students reporting being self-funded only. Nearly half of part-time/remote reported being self-funded only in 2019 and this has gradually declined to four in ten in 2025. By contrast, about one in ten full-time students report being self-funded only over the four waves of data.
Field of study
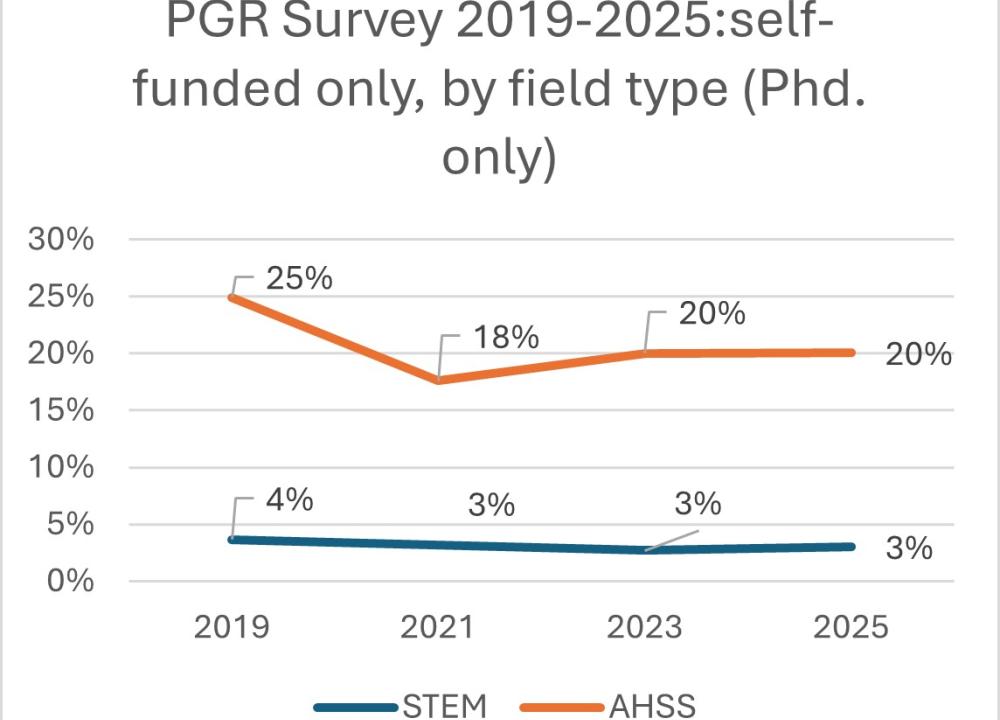
Next we look at field of study, and specifically research students in STEM and in AHSS (arts & humanities, and social science). This chart compares only those students at PhD. level. Less than 5% of STEM PhD. students reported being self-funded since 2019. For AHSS PhD. students, the story is different; in 2019 25% reported being only self-funded. This had declined to 20% in 2025, but still multiple times higher than their STEM peers. It will be interesting to watch this in the 2027 data. Tailing back to our chart on gender above, we know that a higher proportion of females study AHSS compared to males, and with a higher proportion of AHSS being self-funded, this is likely one reason we see a higher proportion of females being self-funded only.
Withdrawal from programme
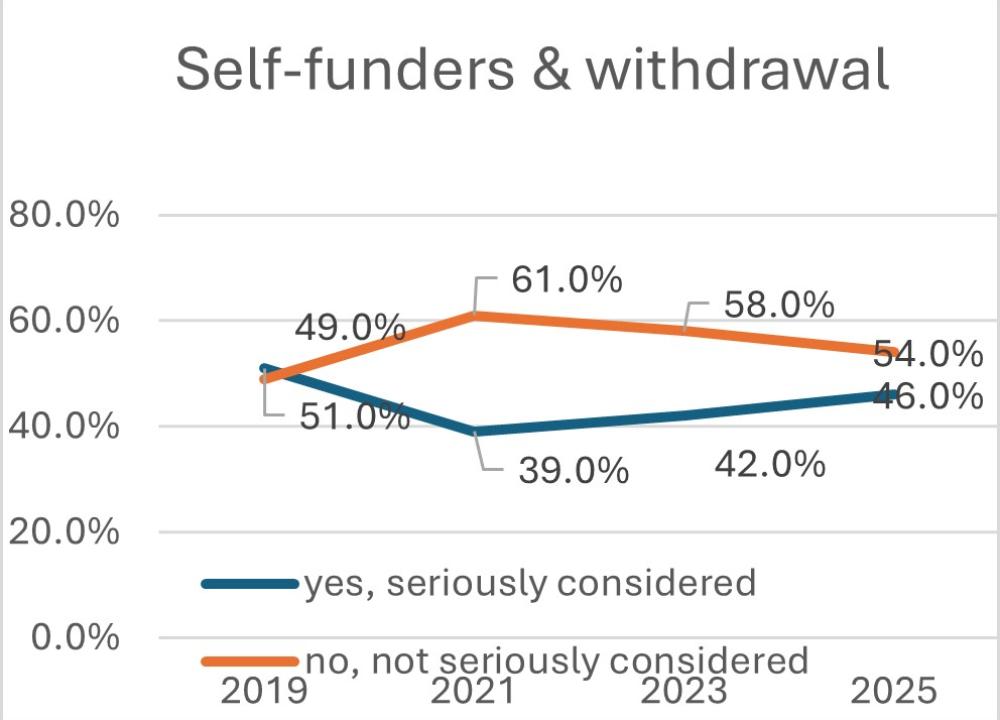
Finally, in the first chart below we looked at consideration of withdrawal among self funders (For comparison, typically, between 40 and 45% of PGR students report having seriously considered withdrawing from their programme).
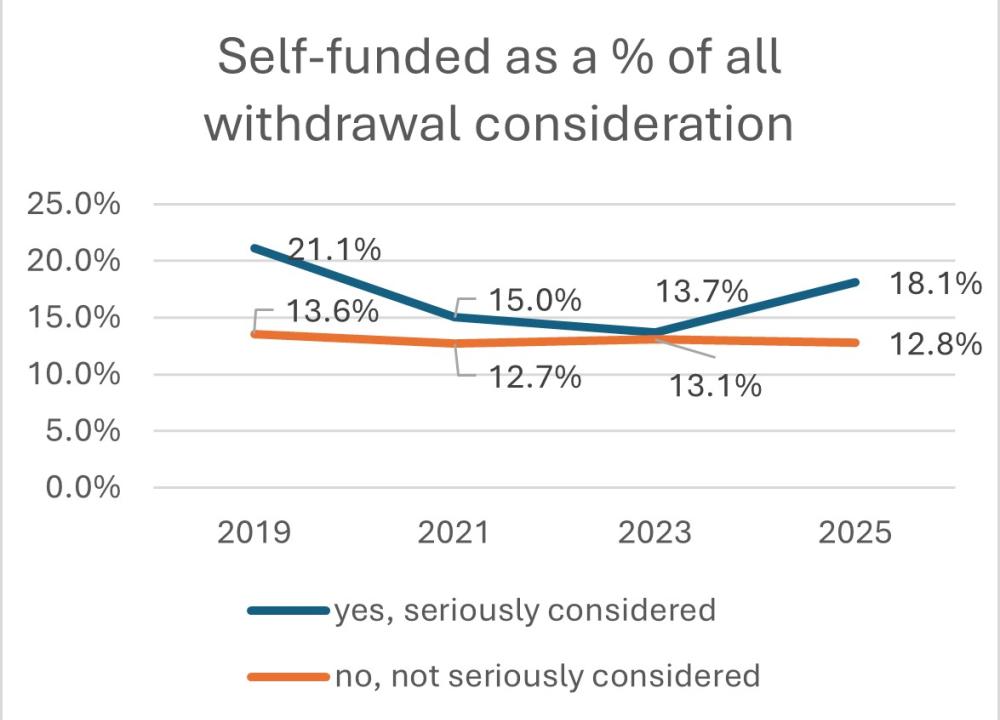
This next chart shows self-funded only as a percentage of all withdrawal consideration. The pattern over time is also very different for the two groups; for those who had considered this, there was an increase to 2019, and then a subsequent decline in both 2021 and 2023, giving way to a rise again in 2025. For those not reporting serious withdrawal consideration, the prevalence is stable around 13% in the years 2019-2025. So reflecting on our first chart with the overall rate of self-funding, that pattern over time of increase to 2019 and then subsequent decline is mirrored among students who had seriously considered withdrawing, but the self-funding pattern is different for those who has not considered withdrawal.
We will continue to blog some analysis of the historic PGR data and to explore what the new 2025 data has been telling us.
We'd love to hear your feedback. Contact us at info@studentsurvey.ie, or follow us on social media:
https://www.facebook.com/StudentSurveyIE
@studentsurveyIE
- https://www.instagram.com/studentsurveyie
@studentsurveyie
- https://www.linkedin.com/company/studentsurveyie/
TikTok
- https://www.tiktok.com/@studentsurveyie
@studentsurveyie
Youtube
- https://youtube.com/@studentsurveyie4526?si=2s6-PywfHtnymJL_
**Self-funding only here means survey respondents who reported being self-funded and reported no other sources of funded from the available options. Respondents who indicated both self-funded and another source of funding (e.g. grant or scholarship fees) are not included in this group.
***Data was weighted according to the following variables:
1. Gender 2. Type 3. HEI 4. Mode 5. Age 6. ISCED
This analysis differs, therefore, from published dashboards, which rely on unweighted data only. By weighting the data, the findings can be generalised to the entire student population.