Digital Capital
In our last blog post reviewing the postgraduate research (PGR) data from 2025 StudentSurvey.ie, we looked at trends in self-funding among our research graduate students. Next in the series: digital capital.
Before we get into it, here is a quick primer on what we are talking about. Recent research from Eurostudent* describes the key dimensions to digital capital in Higher Education as including availability of desk and computer, quiet workplace and sufficient internet connection. An additional dimension, self-assessed digital skills, is not measured here. When we refer to digital capital we specifically mean these four questions in the PGR survey:
- I have a suitable working space
- There is adequate provision of computing resources / facilities
- There is adequate provision of library facilities (including physical / online resources)
- I have access to the specialist resources and facilities necessary for my research
They have been asked every year of the PGR survey and the response option for each is a five-point scale ranging from definitely disagree (score of 1) to definitely agree (score of 5). As there are four questions, the maximum digital capital score is 20 and the minimum is 4**. The scores we report are the mean average. We know from previous analysis of our PGR data*** that these four questions are closely related. They have a Cronbach's Alpha, a measure of their internal consistency, of 0.8, which is considered a good level, and indicates that they may be used a single scale measure****.
Results
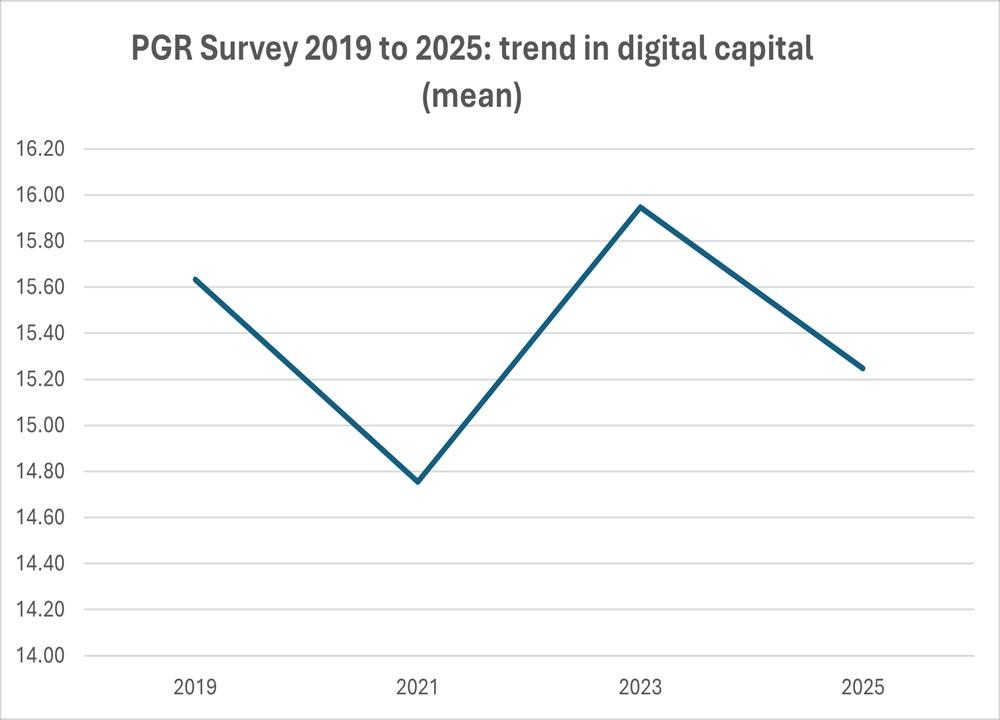
Now let's look at what we found. First up, the overall average scores for all participants. This varies between 14.7 and 15.9, with a dip in 2021. Worth noting that 2021 was the first year of the survey after Covid 19 and the associated restrictions. A second dip, albeit lesser, is also visible in 2025 as digital capital declines from its heights in 2023.
Gender
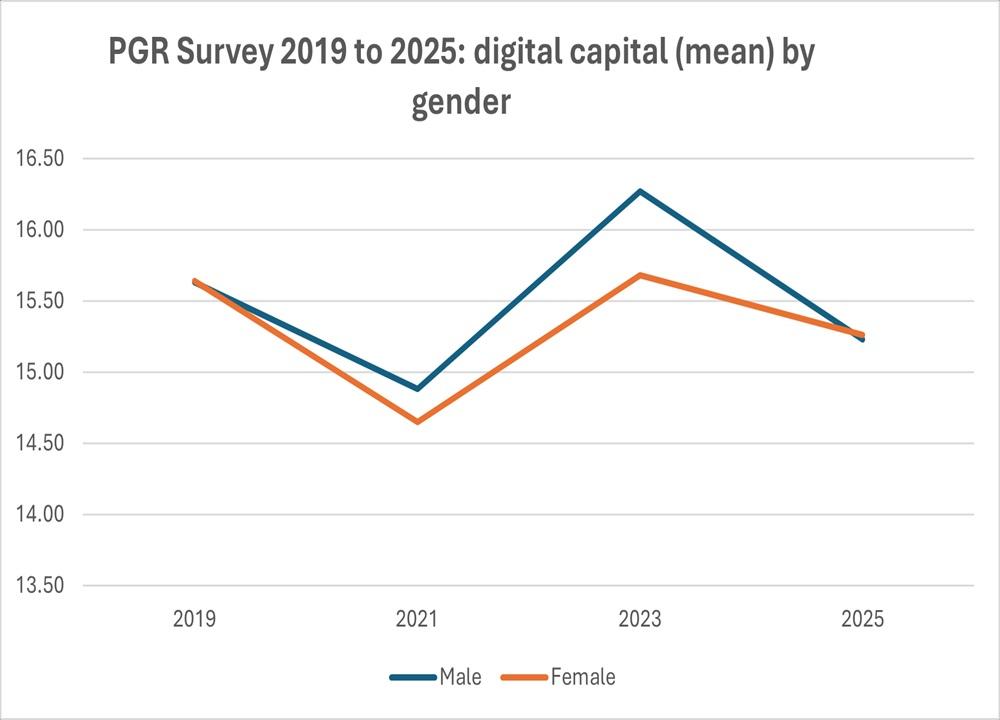
Next gender, and we find males are reporting a higher average digital capital on two of the four years (2021 and 2023). The difference has been thought likely due to males having a higher take up of STEM subjects and indeed STEM students on average report a higher level of digital capital, which we will show later. However, the similarity of numbers for 2019 and 2025 questions this explanation. Other factors may be at play.
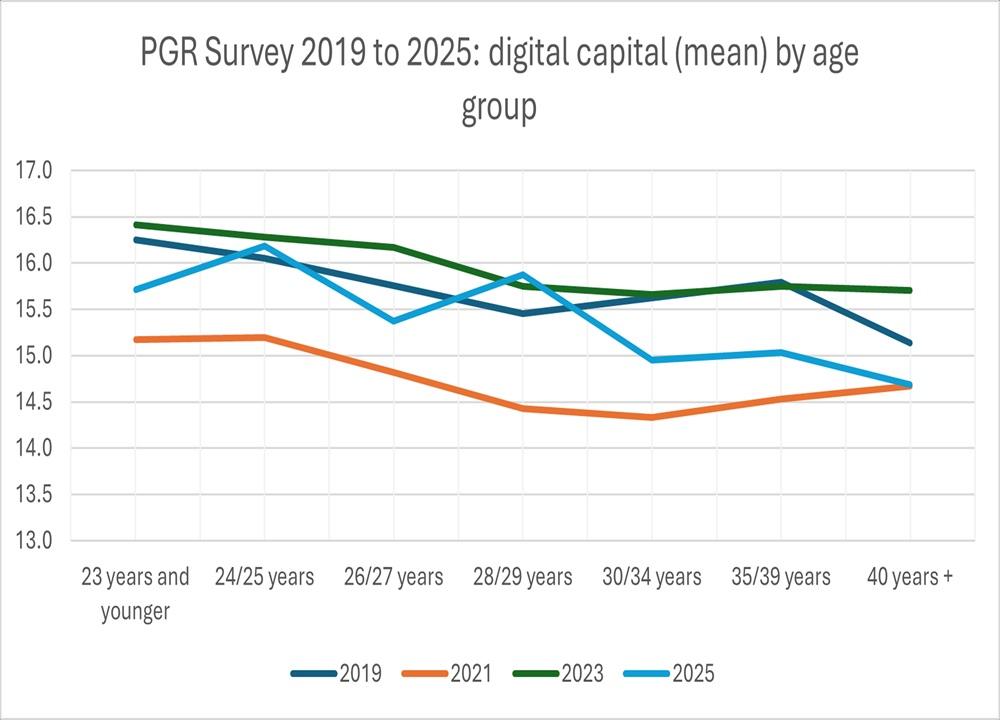
Age
For age groups, this figure shows youngest to oldest across the bottom while each line is a survey year. Two things stand out when we look at age; firstly, the youngest group (25 years and below) had the highest mean score, while there were no clear differences in digital capital among the older age groups. Secondly, we can see the outlying nature of the 2021 survey. This first post-Covid-19 outbreak survey shows substantially lower average digital capital for all age groups compared to the year before and the two years after.
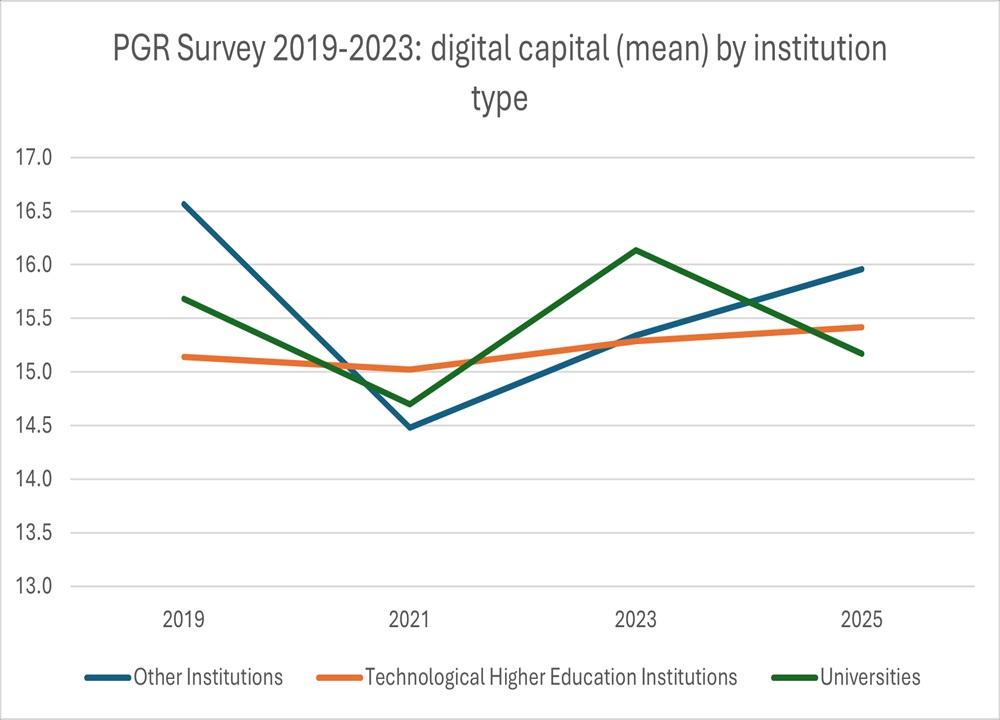
Institution type
Next up, institution type. It’s interesting that Technological HE institutions, which had a lower mean digital capital score than universities, were relatively stable throughout the period and did not meaningfully dip in 2021, unlike most sub-groups we analysed. This might hint that the effect of Covid 19 was most felt by research students attending institutions with a stronger tradition and institutional resources in research, and thus most affected by campus closures and other restrictions. Don’t pay too much attention to the other institutions trend here -frequencies are low and therefore noisy, which is why you see high volatility.
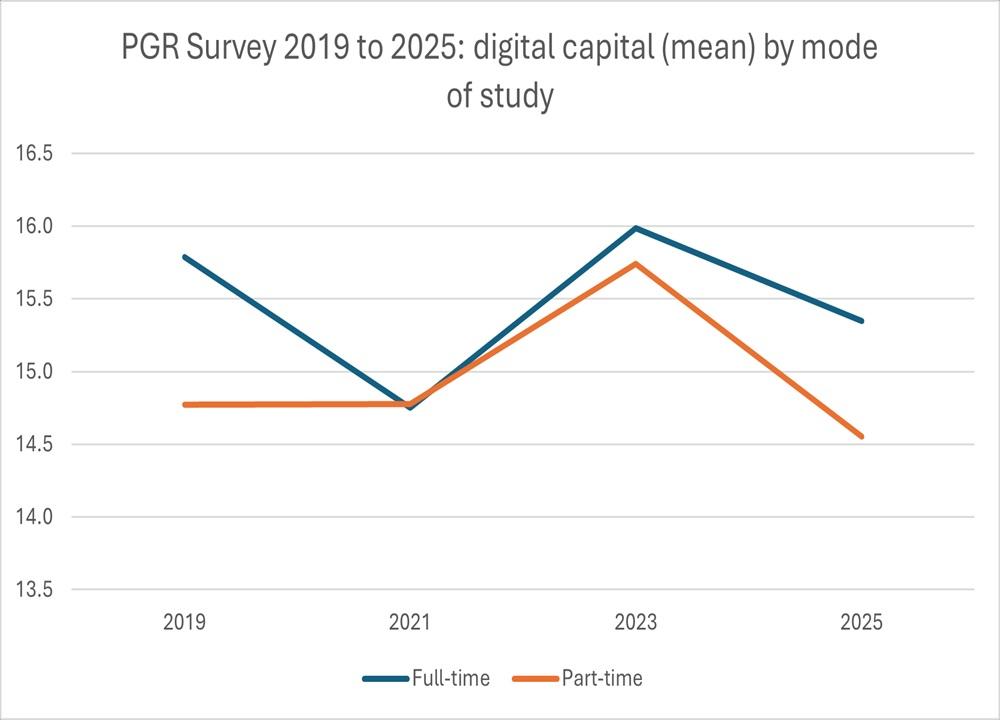
Mode of study
While part-time and remote students have historically reported lower average digital capital scores than full-time students, we can see that this trend evened out a little during Covid and in 2023, before reasserting itself again in 2025 when learners had fully returned to campus.
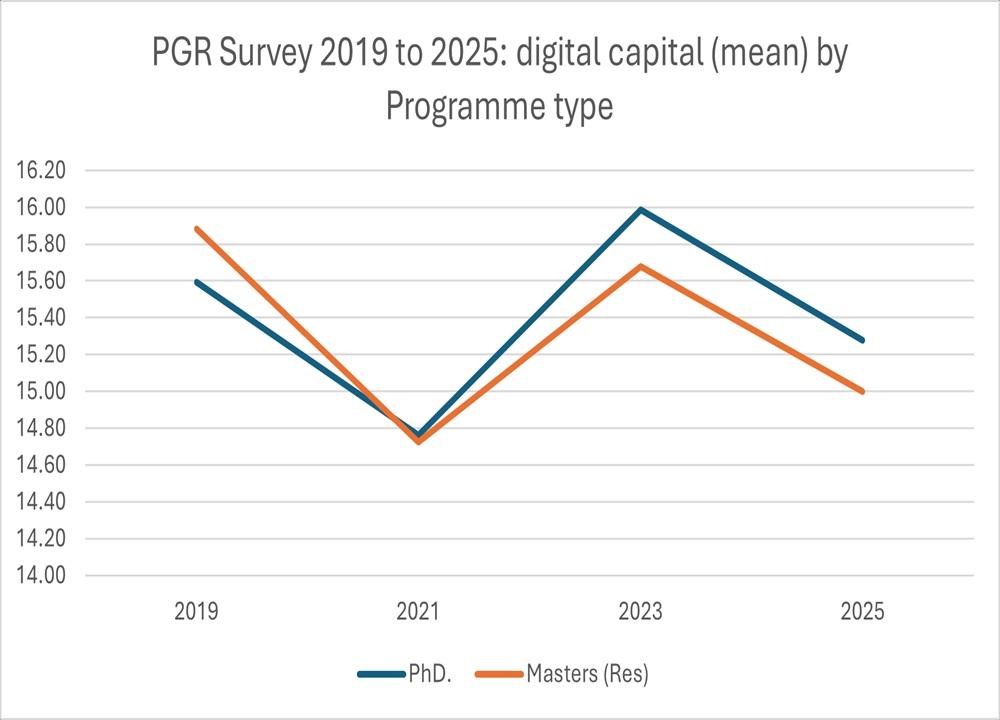
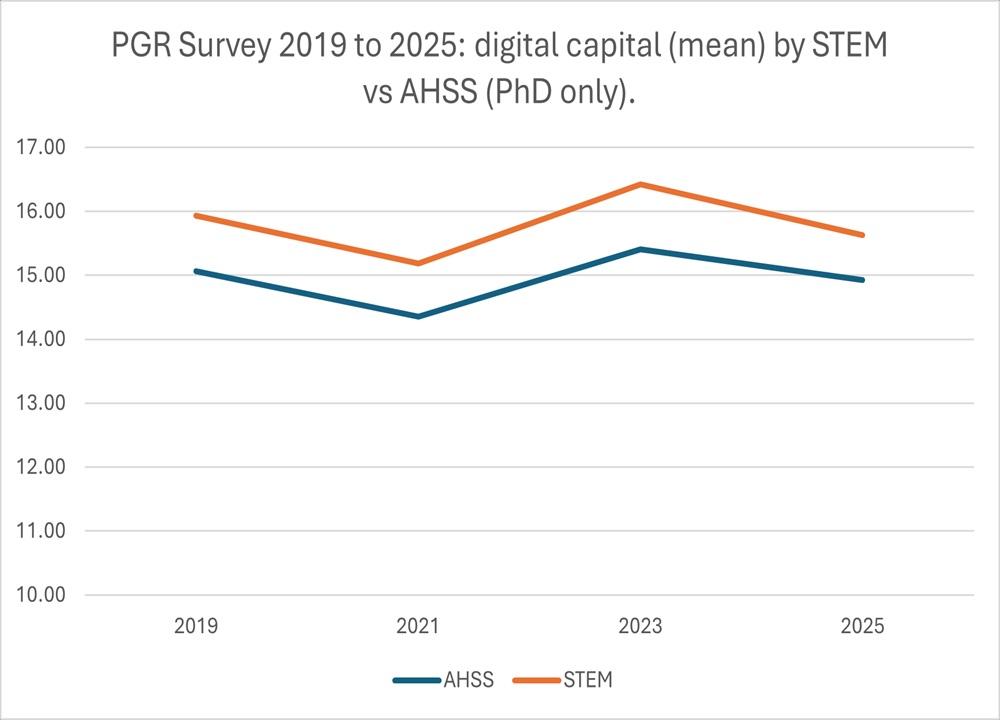
We see little difference between PhD. and Masters students, with a difference of 0.28 between masters and PhD in 2025.
Those PhD. students studying STEM had a substantially higher mean digital capital than those in AHSS, with a difference of 0.69 in 2025, and the differential was stable over time.
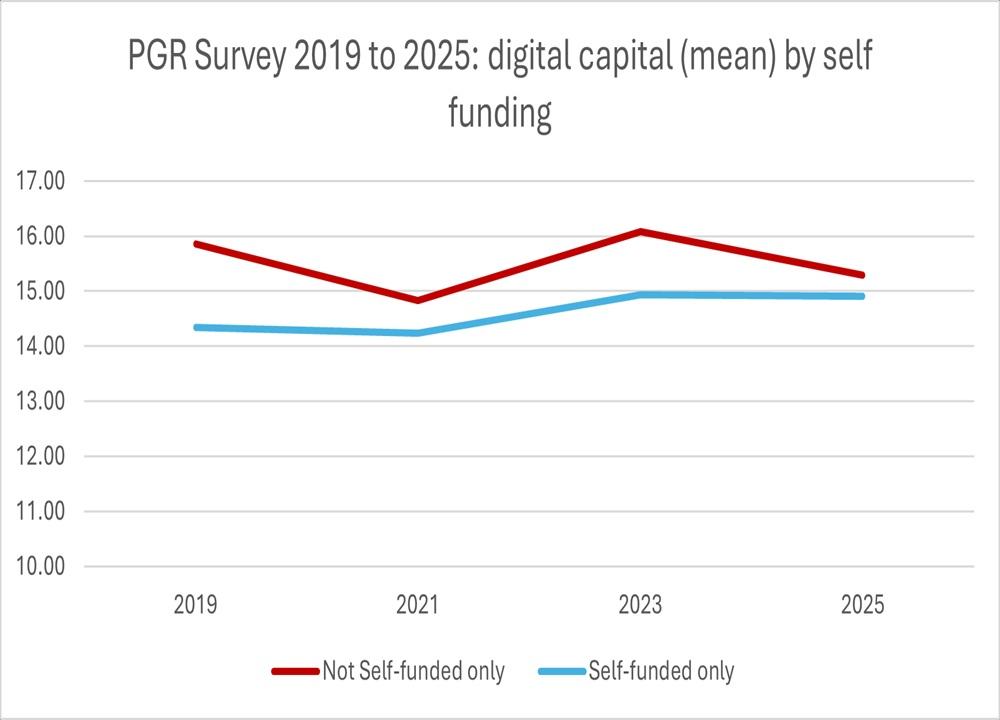
Self-funding
Research students who reported being solely self-funded reported a slightly lower (0.38) average digital capital score than those who do not. This may be because many funded researchers receive allowances for resources.
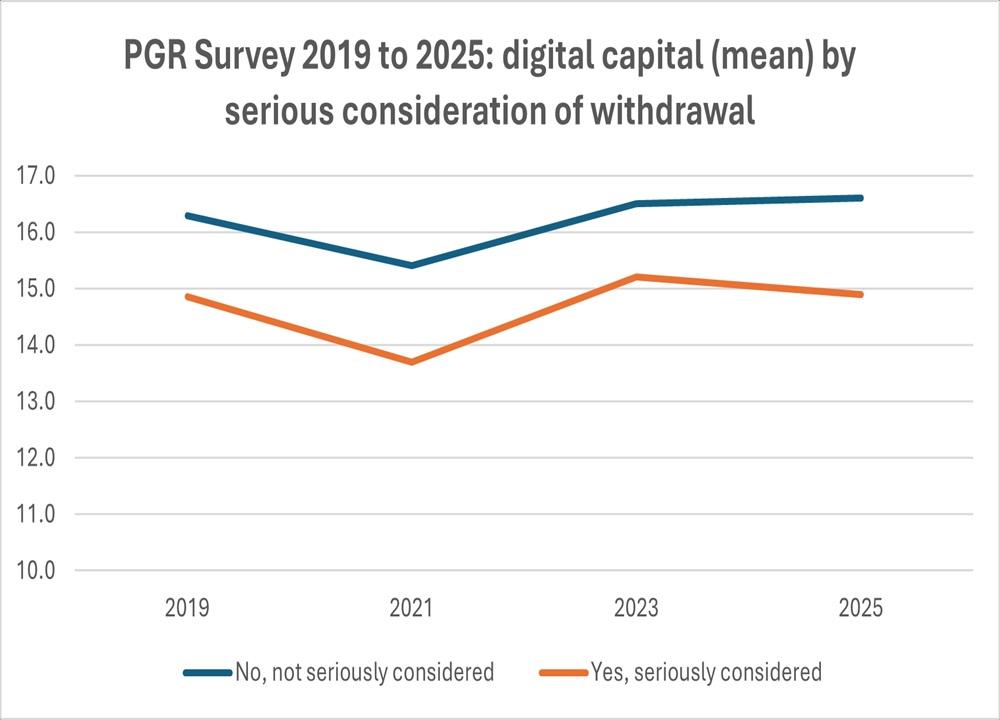
Withdrawal consideration
Finally, to some of the broader evaluation-type questions. Those who reported having seriously considered withdrawing from their programme had lower digital capital scores. It’s a clear difference, and stable over time, but it is not clear what the causal direction might be here if they are indeed linked; is lower digital capital contributing to an increased likelihood of withdrawal consideration, or perhaps there is something related to those more likely to withdraw, such as funding, which also influences their digital capital scores? This might be an important relationship to explore further.
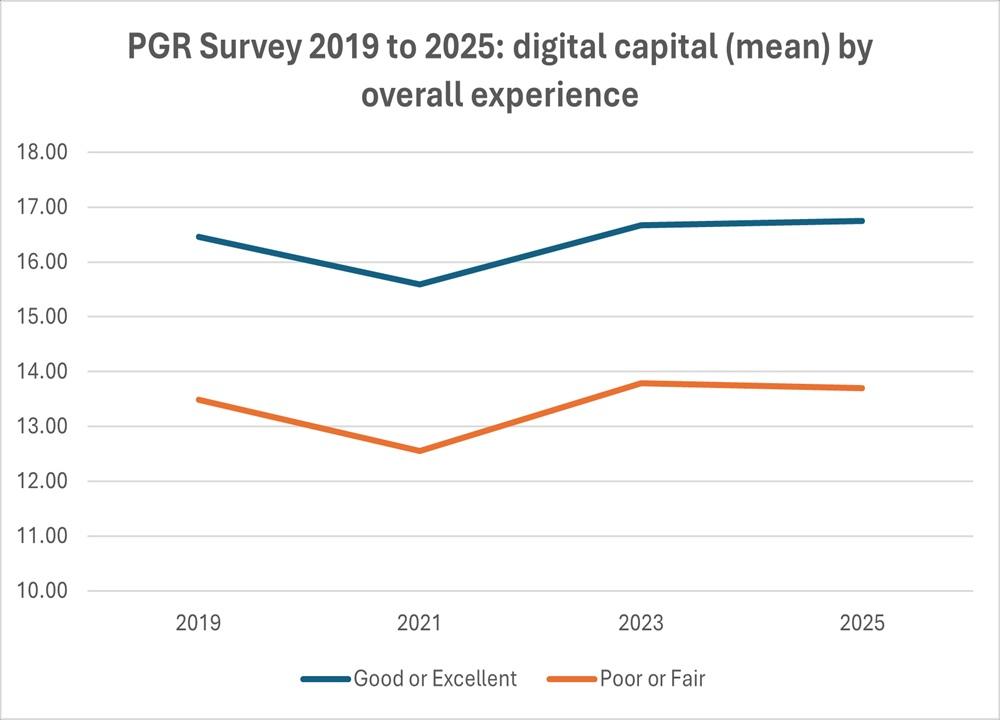
Overall experience
We see an even greater difference for responses on overall experience. Those who reported a good or excellent experience of their HE institution, reported a much higher mean level of digital capital compared to those who reported fair or poor experience.
In summing our brief analysis of digital capital, one of the key trends over time is the decline in 2021. This may be related to the Covid-19 pandemic and the restrictions associated with it in Higher Education. While we can't know that for sure based on the observational evidence here alone, provision of library and computing facilities and suitable working space was undoubtedly impacted by campus access restrictions (these were in place at the time of PGR data collection in February / March 2021). We also see that different groups were affected differently in this regard; full-time research students, those attending traditional universities, female students and those studying AHSS fields declined most in average digital capital in the 2021 survey. Part-time research students and those attending technological universities had little or no decline in that year on the other hand.
We will continue the blog series over the next while. Look out for our next post!
* Schirmer, H. (2024). Digitalisation of teaching, learning, and student life. EUROSTUDENT 8 Topical module report. See here.
** Participants who chose “not applicable” for any of the questions are treated is missing data for digital capital scores. In the 2025 survey data, 424 of 4,225 were treated as missing data on digital capital. The data has been weighted.
***Erskine, S., O’Regan, M. and Harmon, D. (2018). Validity and Reliability of the Irish Student Engagement for Postgraduate Research Students. Insight Statistical Consulting. StudentSurvey.ie See here:
**** Tavakol & Dennick (2011). Making sense of Cronbach's alpha. Int J Med Educ. 2011 Jun 27;2:53–55. doi: 10.5116/ijme.4dfb.8dfd See here.